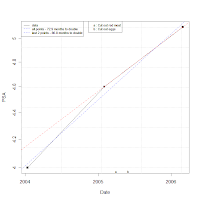
There are online calculators, Excel spreadsheets and instructions on calculating doubling times manually using graph paper in the following post on this blog:
http://palpable-prostate.blogspot.com/2007/02/prosate-cancer-calculators.html
but here we are concerned with how to do it yourself using the free statistical package R. R is available on Windows, Mac and UNIX/Linux but here we assume Windows. If you are not comfortable with programming skip this post.
- Download. First download R from:
http://cran.r-project.org/bin/windows/base/release.htm - Install. To install R double click on the downloaded file and accept all the defaults in the setup procedure.
- Run R. To start R double click on the R icon that appears on your Desktop after installation.
- Find Out More - Optional Step. You can skip this step if you are in a hurry. To find out more about R click on R's Help menu and choose Manuals and then choose An Introduction to R. Even more about R can be discovered through the other manuals listed in that Help submenu, by googling for CRAN Contributed Documentation and by googling for the single letter R.
- Test. Copy the code below into the clipboard (select via mouse and press ctrl-C) and paste it into R.(The first line to copy is the one labelled as ### start code ### and the last line to copy is the one labelled as ### end code ###.)
- Modify Code. Now open Notepad and paste the clipboard (which still contains the code from the last step) into it. Also, replace the three lines of data in Notepad with your own. (The sample data has 3 data points, one per line, but you can have a different number of data points. Each data line should use the exact date format shown in the sample data followed by a comma and the PSA value.)
- Add Events - Optional Step. You can skip this step if you don't want to create and display events along the bottom. One can uncomment the mtext and legend lines near the end of the code and replace the events just above those lines with your own events to cause them to appear along the bottom of the chart. The a and b along the bottom axis and the corresponding second legend in the example above right (click picture to see larger version) are the events that would appear if the last two code lines were uncommented.
- Run. Copy contents of notepad (ctrl-A ctrl-C) to clipboard and paste into R (ctrl-V).
### start code ###

### data ###
# Replace the 3 data lines with your own data.
# Each line represents one PSA test.
# You may have fewer or more lines but should have at
# least 2 lines.  Be sure to use same format.

Lines <- "Date,PSA
2004-01-14,4
2005-02-01,4.6
2006-03-01,5.1
"

### read data ###
# psa.df is a data frame holding a:
# - Date column Date and
# - numeric column PSA

con <- textConnection(Lines)
psa.df <- read.csv(con, colClasses = c("Date", "numeric"))
close(con)

### run regression ###
# run linear model, i.e. regression, and place it in psa.lm
psa.lm <- lm(log2(PSA) ~ Date, psa.df)
psa.lm

### plot data ###
# plot data and then overplot the regression line in blue
# type = "o" means overstrike points and lines. pch = 15 fills points.

plot(log2(PSA) ~ Date, psa.df, type = "o", pch = 15, yaxt = "n", ylab = "PSA")

# label Y axis with PSA values rather than log2(PSA) values
p <- pretty(range(psa.df$PSA))
axis(2, log2(p), p)

grid()

### plot regression line on same chart ###
# lty = 2 means dashed
abline(psa.lm, col = "blue", lty = 2)

### calculate doubling time ###

# calculate the number of days to double
# coef(psa.lm)[2] is the slope of the regression line
dt <- 1/coef(psa.lm)[2]
dt

# calculate the number of months to double
dtm <- 12/365 * dt
dtm

### repeat for just last two point2 ###

# calculate the doubling time in days using only last two points
# and plot on same graph
nr <- nrow(psa.df)
psa23.lm <- lm(log2(PSA) ~ Date, psa.df, subset = (nr-1):nr)
dt23 <- 1/coef(psa23.lm)[2]
dt23
dtm23 <- 12/365 * dt23
dtm23

# plot line through last two points
abline(psa23.lm, col = "red", lty = 2)

### add legend ###
# txt defines the text of the 3 lines in the legend
txt <- c("data",
sprintf("all points - %.1f months to double", dtm),
sprintf("last 2 points - %.1f months to double", dtm23)
)
cols <- c("black", "blue", "blue")
legend("topleft", txt, lty = c(1, 2, 2), col = cols, cex = 0.7)

### optional
### To plot event data replace events that follow with yours
### and uncomment last two lines (beginning with mtext and legend)
eventLines <- "Date,Event
2005-04-01,Cut out red meat
2005-06-01,Cut out eggs
"
con <- textConnection(eventLines)
events <- read.csv(con, colClasses = c("Date", "character"))
close(con)
let <- letters[1:nrow(events)]
# mtext(side = 1, line = -1, text = let, at = events$Date, cex = 0.7)
# legend("top", paste(let, ":", events$Event), cex = 0.7)

### end code ###
No comments:
Post a Comment